
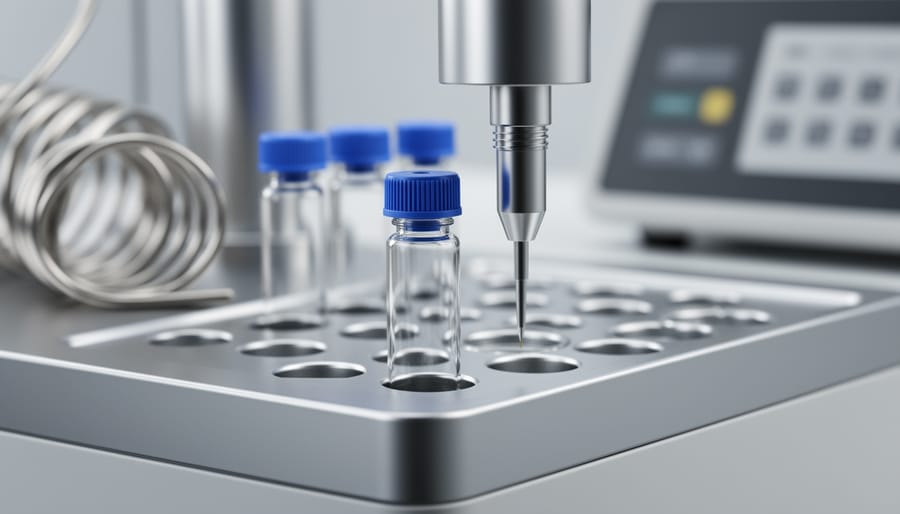
A 98 percent HPLC purity figure on lab-tested research peptides means that when a sample was run through a high-performance liquid chromatography machine, the main compound accounted for 98 percent of the total detected signal, and everything else detected made up the remaining 2 percent. It’s a share of what the instrument saw, not a promise that 98 percent of the powder in the vial is your target compound.
Key Takeaway: 98 percent HPLC purity describes the share of detected signal from the target compound, not a total content guarantee. Water, salts, and anything the detector can’t see sit outside that number, so read it alongside the rest of the certificate of analysis.
Think of it like listening to a track on a good set of headphones. If you can only hear the instruments that are actually playing, you can say the vocals made up 98 percent of what reached your ears. You still can’t say much about the silence, the room, or anything the mic never picked up. Just as we love hearing clean mixes where every element is easy to identify, chemists want a clean chromatogram where one peak clearly stands out.
That’s why this number matters to researchers, buyers, and the quality-control teams who review reports every day. If you’re comparing research peptides, knowing what 98 percent covers, and what it leaves out, helps you decide whether it’s good enough for your purpose.
What 98 Percent HPLC Purity Means in Plain Language
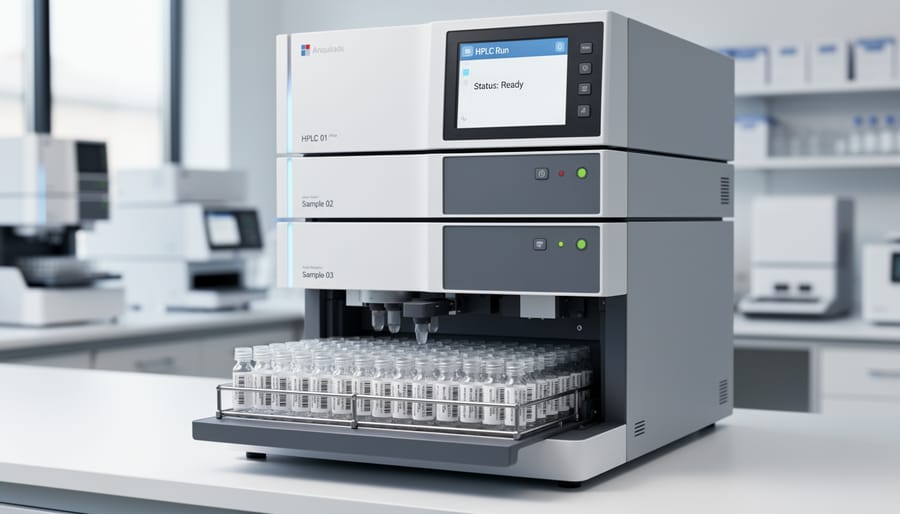
Reading the Number: Signal, Not Weight
Think of a drum kit and a triangle. Both can play in the same song, but the drum hits the room much harder. A detector in an HPLC instrument works a bit like your ear: it responds to each compound differently, and some compounds simply “sound” louder than others.
That’s the heart of the signal-versus-weight difference. A 98 percent purity figure describes how much of the detector’s response came from your target compound. It doesn’t directly describe how many grams of the sample are that compound.
Here’s why the two can drift apart. Most HPLC detectors measure how much light a compound absorbs at a chosen wavelength. A compound that absorbs strongly can produce a big peak even when there’s very little of it, while one that barely absorbs might hardly register at all, even if plenty is present.
So a quiet impurity can hide in the background, and a loud one can look bigger than it really is. Both numbers matter, and they answer slightly different questions. Signal tells you what the instrument saw; weight tells you what’s physically in the container.
How an HPLC Purity Number Gets Calculated

Key Terms You’ll See on a Lab Report
Flip to the back of a certificate of analysis and you’ll meet a short list of words that come up again and again. Think of this as the liner notes: a quick guide to who’s playing what.
- Chromatogram
- The graph the instrument draws as your sample passes the detector, with time along the bottom and signal strength up the side.
- Peak
- A bump on that graph. Each peak is one component of the sample, and a taller or wider bump means more of it was detected.
- Retention time
- How long a component takes to travel through the column before it reaches the detector. It works like a fingerprint for spotting the compound you expect.
- Area percent
- The target peak’s area divided by the total area of all peaks, shown as a percentage. This is usually where a figure like 98 percent comes from.
- Detector wavelength
- The colour of ultraviolet light the detector uses to “see” the sample. Only components that respond to that light show up as peaks.
- Impurity
- Anything detected in the sample that isn’t the target compound, such as leftovers from manufacturing or breakdown products.
Once you know these six words, a lab report stops looking like a wall of numbers and starts reading like a story. The chromatogram is the picture, the peaks are the cast, and area percent is the headline figure that summarizes who showed up. Pay special attention to the detector wavelength line, because it tells you which parts of the cast the instrument could actually see.
What 98 Percent Doesn’t Tell You
A purity figure is a useful number, but it only describes what the instrument could see. Think of it like a live recording: a clean take sounds great, yet the microphone only captured what was in front of it. Knowing where an HPLC result goes quiet helps you use it wisely.
Here are the common blind spots of an area-percent purity figure:
- Impurities that don’t absorb light at the chosen detector wavelength may not show up at all.
- Compounds that co-elute can hide underneath the main peak and get counted as the target.
- Non-UV-absorbing substances, such as many salts, sugars, and some solvents, stay invisible to a standard UV detector.
- Moisture and residual solvents usually need their own separate tests.
- Unnamed impurities may be present at a few percent without anyone knowing what they are.
That last point deserves a moment. Two samples can both read 98 percent, yet one might carry a harmless trace of a related compound while the other carries something you’d really want to know about. The percentage alone can’t tell you which is which.
The testing method matters just as much. A different column, solvent mix, or detector wavelength can shift the result, because each setup “listens” for different things. That’s why the same material can give slightly different numbers in different labs, and why a method description is worth reading right alongside the figure.
None of this makes 98 percent a weak number. It’s a solid, informative starting point. It simply works best as one piece of a bigger picture, paired with identity confirmation, water and solvent testing, and a clear look at how the analysis was done.
Where 98 Percent Is Good Enough, and Where It Isn’t
Whether 98 percent is “good enough” depends entirely on the job. Think of it like choosing a recording setup: a phone memo works fine for jotting down a melody, but you’d want a proper studio for the album.
For general research or early-stage screening, 98 percent is often perfectly workable. Scientists use it to test an idea, compare candidates, or decide what deserves a closer look, and a small amount of unknown material rarely changes the answer. That’s good news for small independent labs and startups working with tight budgets.
Pharmaceutical, food, and cosmetic uses are a different story. Here, regulators and customers care about what the remaining 2 percent actually is, not just how big it is. A tiny amount of the wrong impurity can matter far more than a larger amount of something harmless, so these fields usually demand tighter limits, named impurities, and extra tests alongside HPLC.
Analytical reference standards sit at the top of the ladder. Labs use them as the yardstick for measuring everything else, so they typically need much higher purity, carefully documented, because any flaw gets passed along to every result built on top of them.
Behind all of this are real people. Quality-control analysts and lab technicians read these reports every single day, and the demand for lab jobs keeps growing alongside the pharmaceutical and food science sectors. If you’re curious about quality-control careers knowing how to interpret a purity figure is a great first skill. And whether it’s a university lab, an instrument maker, or a scrappy startup, Canadian research relies on exactly this kind of careful reading.
How to Read a Purity Claim With Confidence
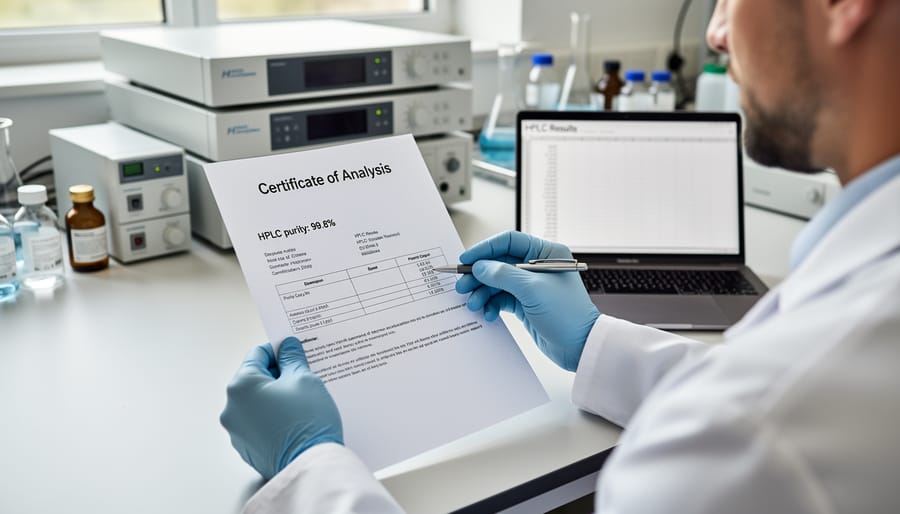
Reading a certificate of analysis gets easier once you know where to look. Start with the method. A good report names the technique and the detector wavelength, because a purity figure only means something alongside the conditions that produced it. Next, check who ran the test. A report from an independent lab gives you a second set of eyes, while an in-house result is still useful but tells a different story.
Look for the batch or lot number and the test date. Those details tie the report to the exact material in your hands, rather than a similar batch made months earlier.
Then compare purity with identity. Purity says how clean a sample is, and a technique like mass spectrometry helps confirm that the main peak is actually the compound you expect. Seeing both on one report is a great sign.
If something is missing, just ask. Reputable labs and suppliers are usually happy to share the chromatogram, the method details, or a clearer copy. Curiosity is how good quality control works, and asking questions is part of doing the job well.
Common Questions About HPLC Purity Percentages
Got questions? You’re in good company, because these are the ones that come up most whenever someone first meets a lab report.
Is 98 percent purity good?
For many general research and screening uses, yes, it’s a solid result. Whether it’s good enough for you depends on the job, since regulated products and reference standards usually demand more.
Is 99 percent always better than 98?
Not automatically. A 99 percent figure from a weak method can hide more than a 98 percent figure from a thorough one, so the testing details matter as much as the number.
Does 98 percent purity mean the other 2 percent is harmful?
No. The remaining 2 percent is simply other detected material, and it could be harmless leftovers from making the compound. What those components actually are is a separate question the purity number can’t answer.
Can two labs report different purity for the same sample?
Yes. Different columns, detector settings, and ways of drawing the peaks can nudge the result up or down, just as two engineers might mix the same track a little differently.
What’s the difference between HPLC purity and assay content?
HPLC purity describes the share of detected signal from your target compound. Assay content measures how much of the target is actually present by weight, which also accounts for water, salts, and other things the detector may not see.
If your question isn’t on the list, don’t be shy about asking the lab or supplier directly. A good one will be happy to walk you through their report.
So, what does 98 percent HPLC purity really tell you? It’s a useful snapshot: roughly 98 percent of the signal the detector picked up came from your target compound. That’s good news, and it’s a solid place to start. But the number tells its fullest story when you read it alongside the method details, the identity confirmation, and any other tests on the report.
Asking “what’s behind this figure?” isn’t fussy. It’s how good work gets done. Whether you’re a lab tech running samples in Saskatoon, a small-batch maker in Moncton, or an independent creator who just wants to trust what’s in the bottle, that curiosity is what keeps quality at the heart of what we do. Keep asking, keep learning, and keep celebrating the people who care enough to check.